Financial Data
 Trends in Financial Indicators (graphs)
<Financial Results>
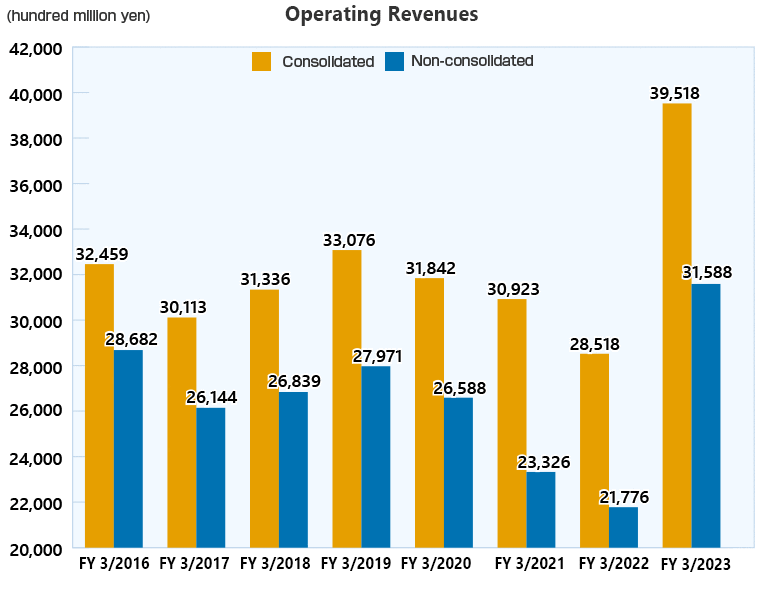
- ・Net sales(consolidated/non-consolidated)
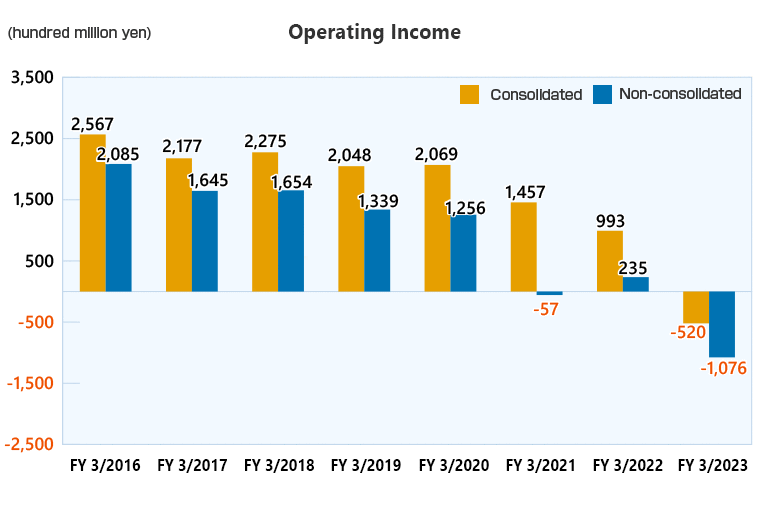
- ・Operating profit(consolidated/non-consolidated)
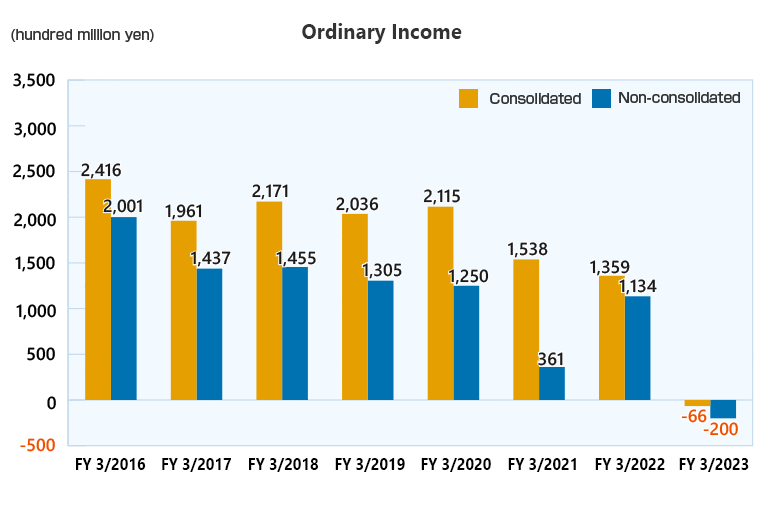
- ・Ordinary profit(consolidated/non-consolidated)
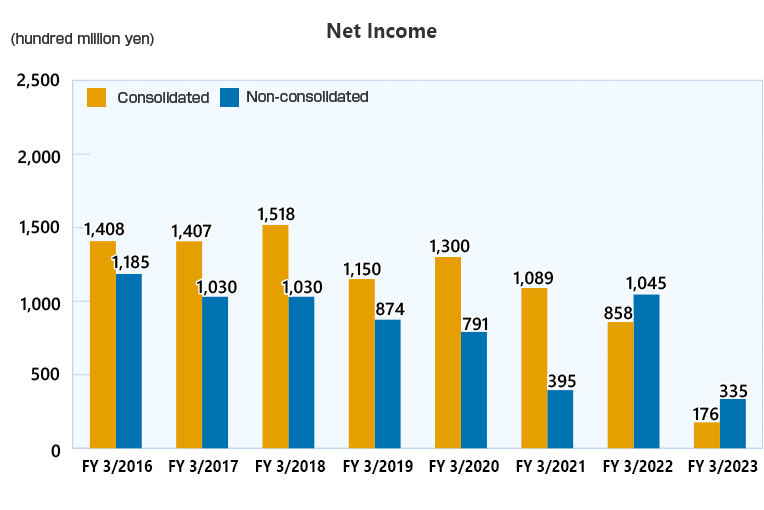
- ・Net Income(consolidated/non-consolidated)
<Safety>
-
・Capital adequacy ratio(consolidated/non-consolidated)
[Capital adequacy ratio = Shareholders' equity/Total assets]
Graph showing the ratio of shareholders' equity (net assets) to total assets.
A high equity ratio is considered indicative of financial health. 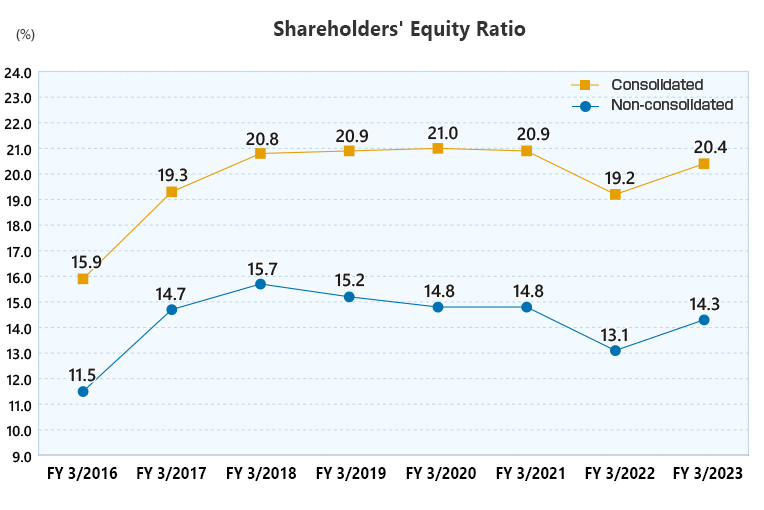
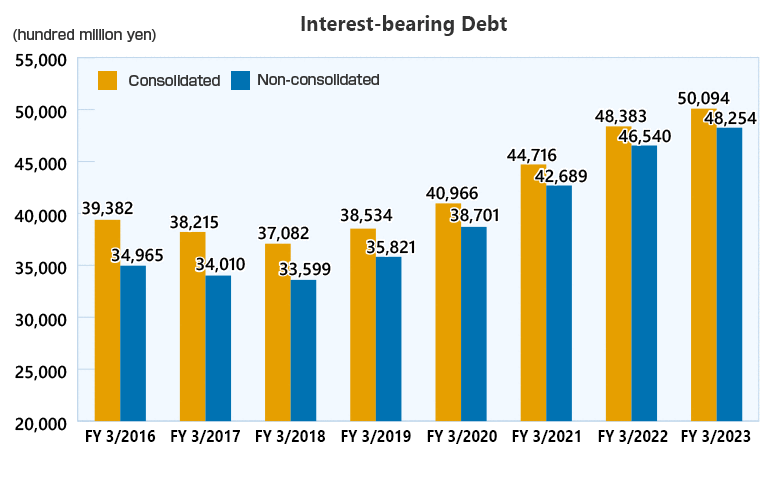
- ・Interest-bearing Debt
<Profitability>
-
・Free Cash Flow(consolidated)
[Free Cash Flow = Cash flows from operating activities + Cash flows from investing activities]
This can provide for new business investment, return to shareholders, and repayment of interest-bearing debt. 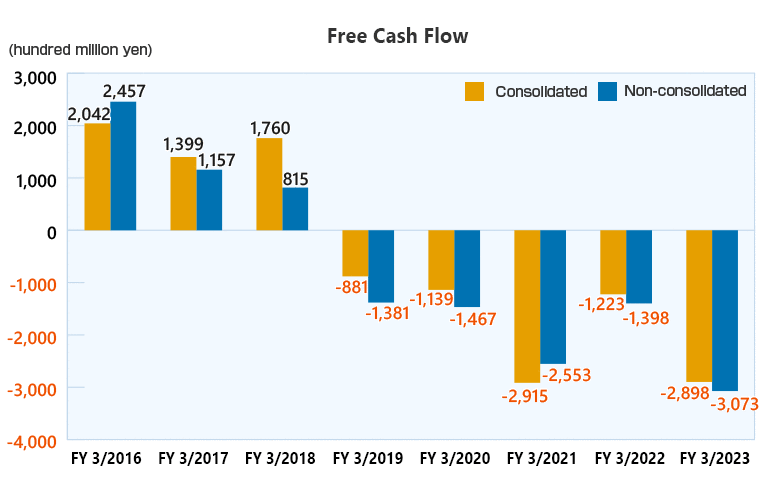
<Efficiency>
-
・Return on total assets (ROA) (consolidated)
[ROA=Business profit [Ordinary profit + Interest expense] / Total assets [Beginning and ending balance average]]
Indicates company efficiency at using all assets to increase profit (business income).
Note: At Kansai Electric Power, "business income" is considered ordinary income before interest and is assumed to indicate regular business profits. 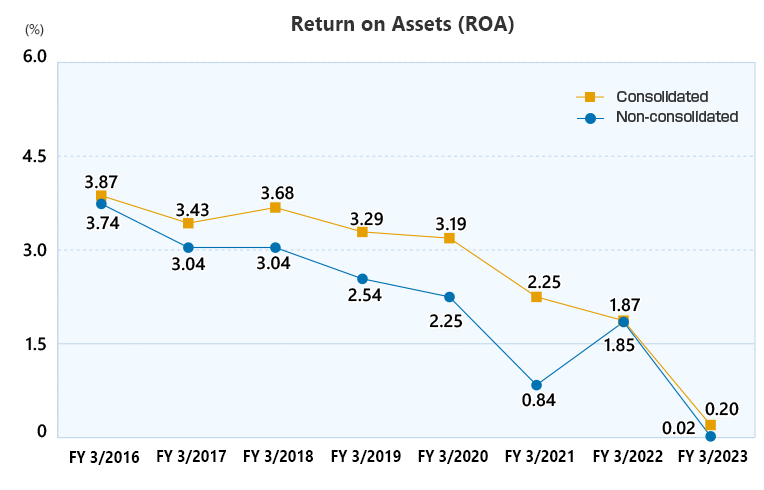
-
・Return On Invested Capital(ROIC)(Consolidated)
[ROIC=Business profit after tax / Invested capital[Beginning and ending balance average]]
[It shows how efficiently the company is making a profit (business profit) relative to its invested capital.] 
-
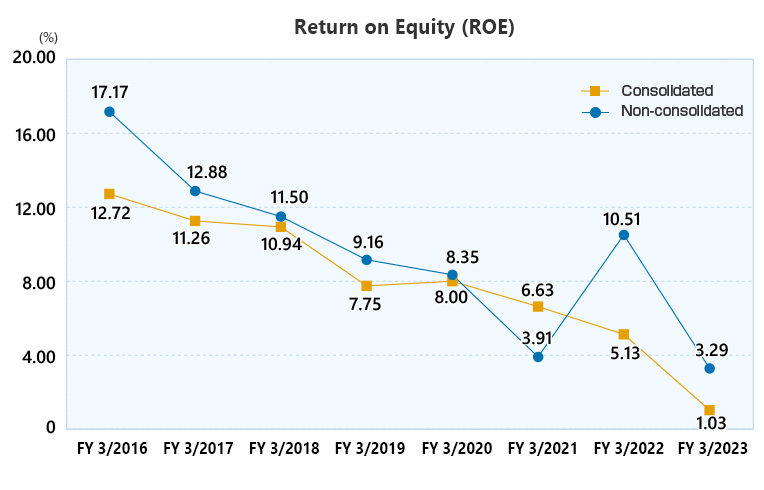
・Rate of return on equity(ROE)(consolidated)
[ROE=Net income / Equity [Beginning and ending balance average]]
Indicates ratio of net income for current term to total equity (total assets) of the company.
-
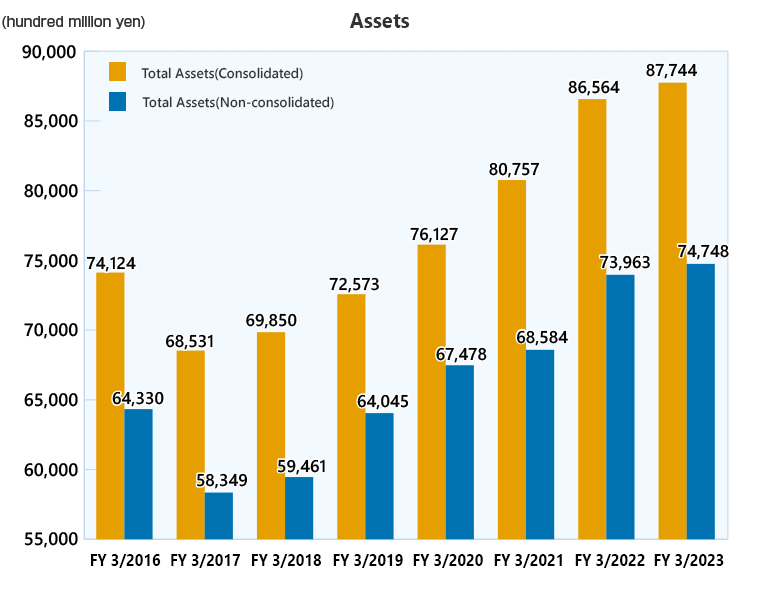
・Total Assets(consolidated/non-consolidated)
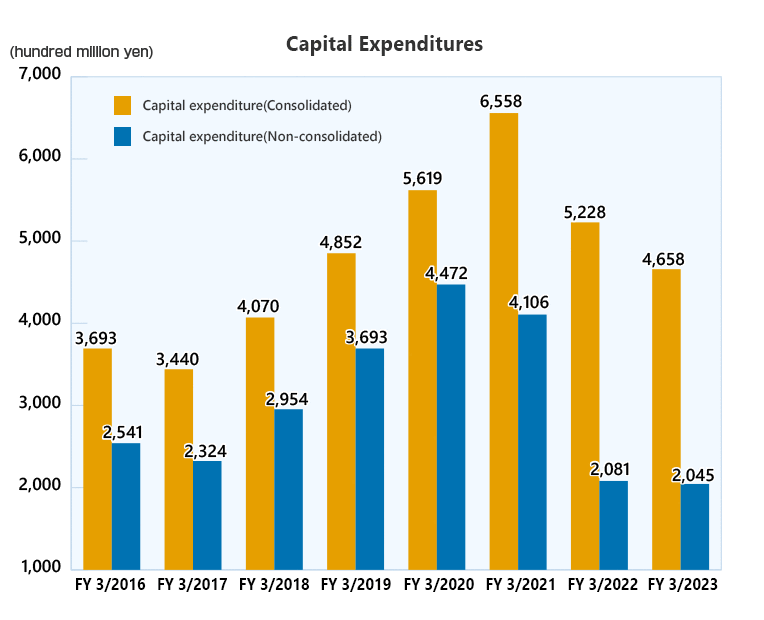
- ・Capital Expenditures(Consolidated)
<Investment Indicators>
-
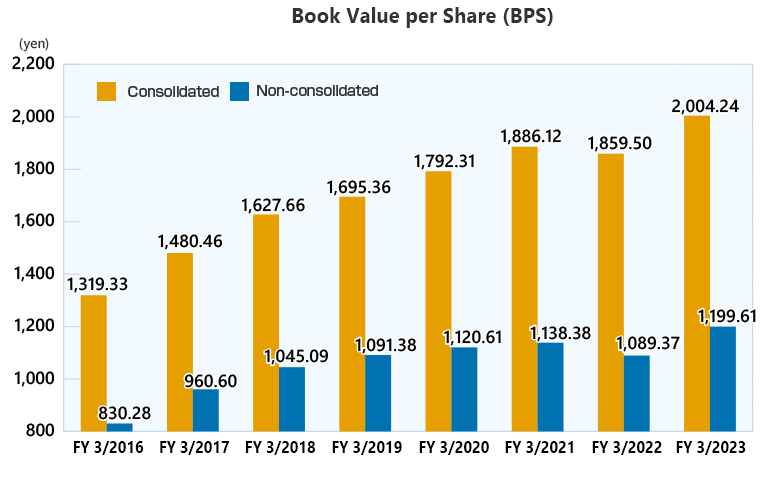
・Book Value per Share (BPS)(consolidated/non-consolidated)
[BPS = Book value (shareholders' equity)/Total number of shares issued]
Total equity divided by number of shares issued.
-
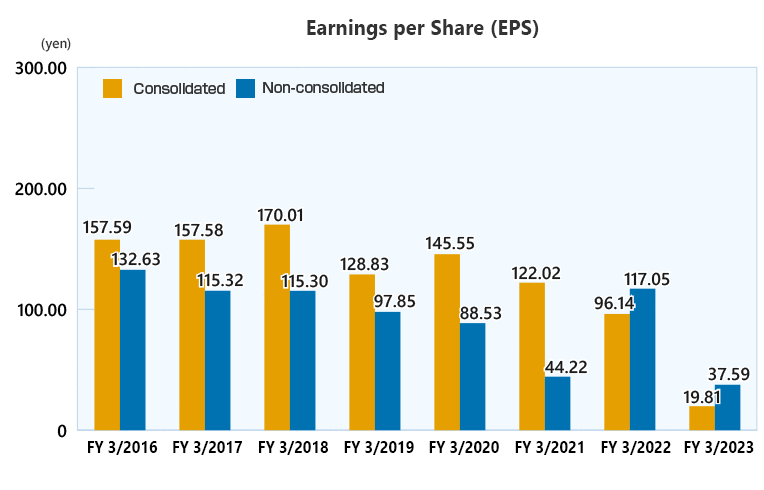
・Earnings per Share (EPS)(consolidated/non-consolidated)
[EPS = Net income/Shares of common stock issued]
Net income divided by the number of shares of common stock issued.
-
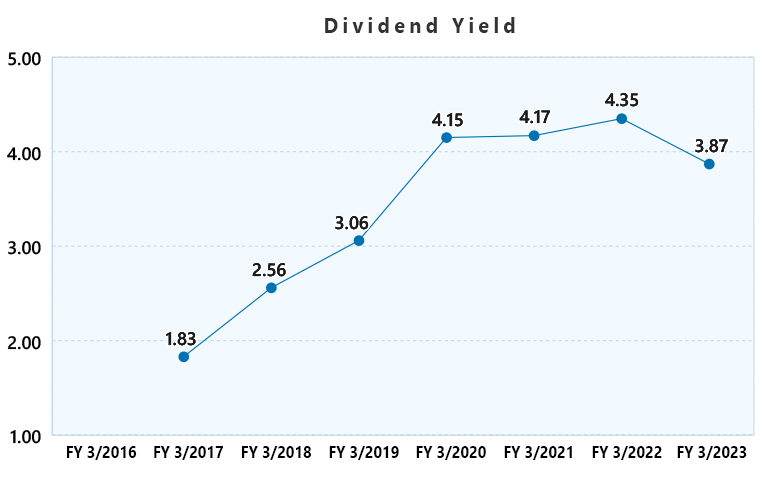
・Dividend Yield
[Dividend Yield = Cash dividend per share/Share price at end of fiscal year]
Indicates ratio of cash dividend to share price.
-
・Price Earnings Ratio (PER)(consolidated)
[PER = Share price at end of fiscal year/Net income per shar]
Share price divided by net income per share indicates whether the share price is high or low relative to profitability. 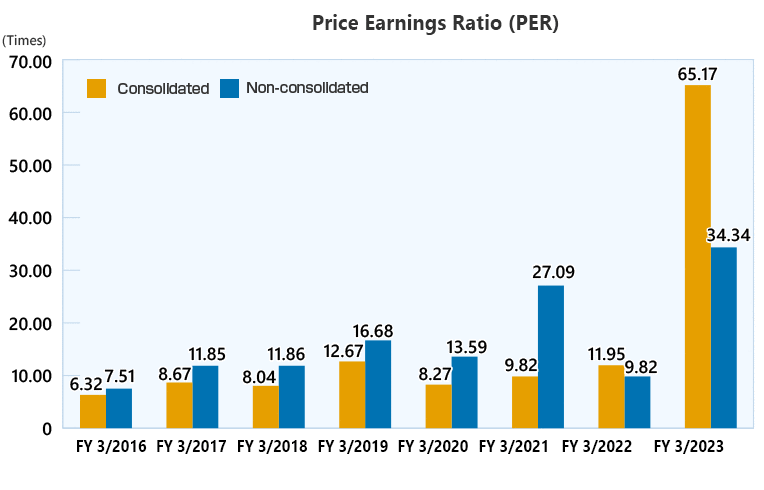
-
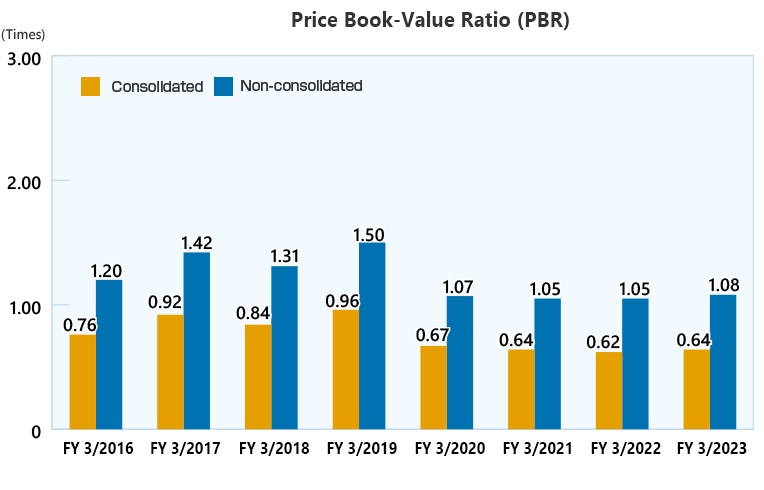
・Price Book-Value Ratio (PBR)(consolidated)
[PBR = Share price at end of fiscal year/Equity per share]
Share price divided by equity per share indicates whether the share price is high or low relative to asset. 